President's Message: It’s Not About Making Trusses Sexy
President's Message: It’s Not About Making Trusses Sexy
My goal as president is a simple one: It’s to help everyone sell more components.
![]()
Looking at recent market share data in the 2019 Annual Builder’s Practices Survey, roof trusses account for 63.8 percent of all roof framing (Figure 1). That is a solid percentage of the market. However, when you account for the fact that in states like mine (Florida), where the roof truss market share approaches ninety percent, there are is still a lot of opportunity for growth. The best example is Texas, where the roof truss market share is considerably less.
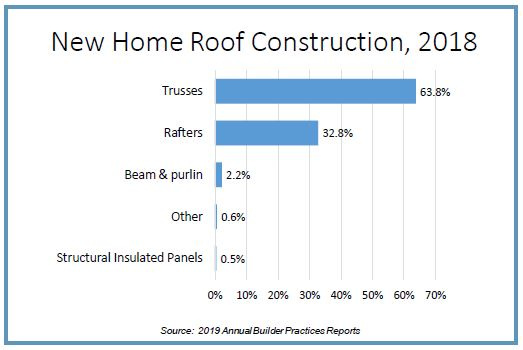
Figure 1. Click to enlarge.
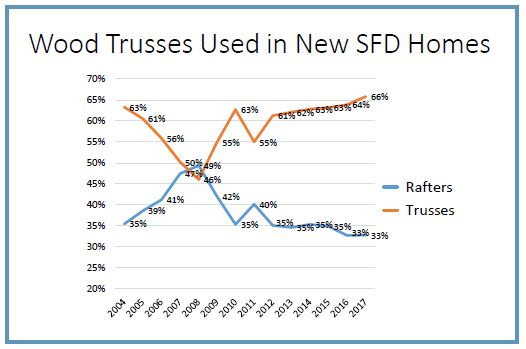
Figure 2. Click to enlarge.
The trend line for wood truss use among builders has been steadily moving in an upward direction (Figure 2). This is most likely due to the continued push by builders to reduce cycle times while needing to build more homes with less available onsite labor.
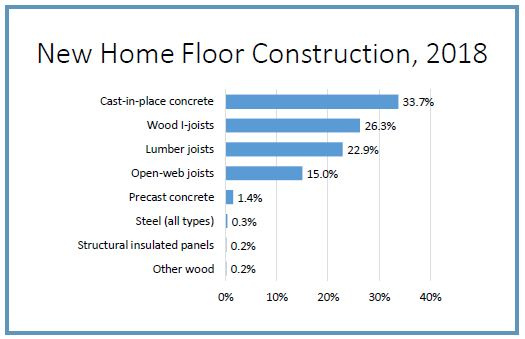
However, beyond roof trusses, floor trusses account for only 15 percent of floor framing (Figure 3).
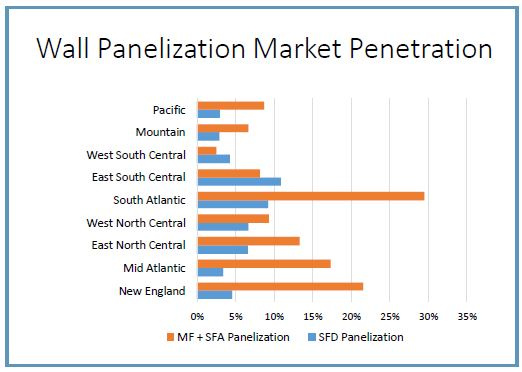
Wall panel use, on the other hand, is highly variable, with greater market share in multi-family construction than single-family. That variance increases depending on the region of the country (Figure 4).
Given the widespread jobsite labor shortage facing the residential construction industry, those low market share numbers point to a lot of sales opportunities for our industry.
A few companies would like the residential construction industry to believe they’ve figured out a “new way” to do things, but we all know this isn’t true. Gaining more market share isn’t about making trusses sexy, it’s about making it more clear just how many of our customersʼ current challenges can be solved by using components. Trusses and panels can enable our customers to build more units in less time, helping them to achieve their sales goals.
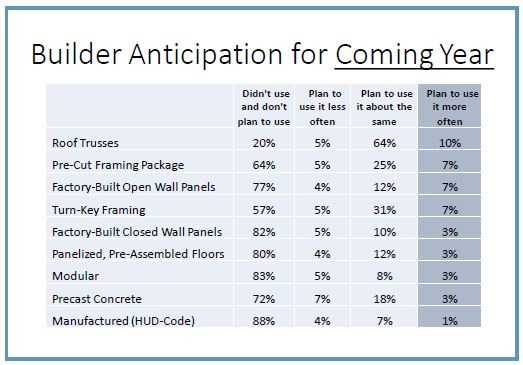
Figure 5. Click to enlarge.
According to that same builder survey, the current market is very favorable for our industry. In the coming year, builders say they would like to increase the use of roof trusses by ten percent, pre-cut packages by seven percent, wall panels by seven percent, and floor cassettes by three percent (Figure 5). If our industry simply capitalizes on that desire, at current home starts our industry would grow by at least five percent!
Looking out five years, builders say they want to increase the use of roof trusses by 15 percent, wall panels by 12 percent, pre-cut packages by nine percent, and floor cassettes by seven percent (Figure 6). That would mean our annual industry growth over the next five years should be at a minimum between three and four percent. This might be even greater given our experience that once customers switch to components they appreciate the efficiency gains and don’t turn back.
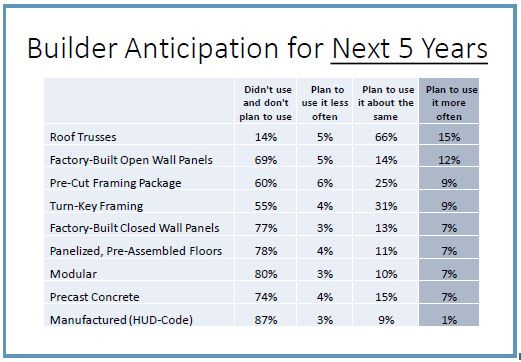
Figure 6. Click to enlarge.
One important insight is that large, production builders want to increase their wall panel use by 27 percent over the next five years and increase floor cassette use by 14 percent (Figure 7). As these companies seek to transform the way homes are built, smaller builders are likely to follow suit.
This research spotlights how important it will be to talk to all our customers to drive home how roof trusses, wall panels, and floor trusses solve their greatest challenges regarding jobsite labor and cycle times. The time is right for us to let builders know they don’t need to be searching for a new solution because we already have the solution they’re looking for.
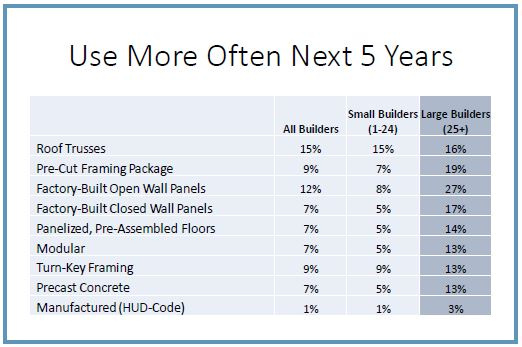
Figure 7. Click to enlarge.
Our customers are focused on only a few attributes in their transactions with our industry: lowest in-place cost possible (which profits everyone in the stream of commerce), cost stability, reductions in construction cycle times, improvements in labor efficiency, durability, and quality.
Component manufacturers who can deliver on one or more of these attributes through the supply chain (Figure 8) stand to grow market share and/or increase profitability far in excess of the industry average.
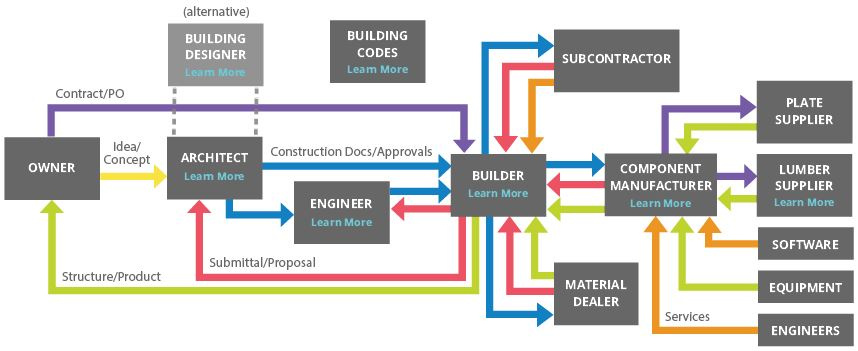
Figure 8. Click to enlarge.
We are a mature, sophisticated, highly technical industry, and most of our customers simply don’t understand what we are capable of doing for them when they’re willing to pay for it.
Some of this ignorance is simply due to a lack of communication. That’s the main reason SBCA is going to have a greater presence at the International Builders Show at the end of this month. A sizable contingent of the SBCA board, along with some SBCA staff, are going to be at the show this year on a mission to gather intelligence.
We will be walking the show floor, spending some time in the booths of our suppliers who are exhibiting, and learning more about what builders, general contractors, and the trades are looking at as well as what conversations they are having with companies up and down the supply chain. This will give us greater insight into how our customers are seeking to solve their problems and help us tailor the messages each of us should be using to sell more of our products and services.
If you are coming to the IBS show, I’d love to know about it (president@sbcindustry.com) and invite you to be part of our intelligence gathering efforts.